Component lab
Images, interactive models, diagrams, and typography for cade.io.
This is the working reference for article components. Figures and diagrams arrive already rendered; interactive models add controls when they enter view.
Widget previews
Try these additions on the same images. Each one is optional for an individual post.
Inspect detail without leaving the article
The same figure at the same reading size. In the proposed version, click the image, then press Escape to return.
Current · inline figure

Proposed · optional enlargement
Use this figure in a post
<ZoomFigure src={image} alt="Describe the image" caption="Explain the figure" original="/posts/your-post/original.webp" />Compare two renders at the same position
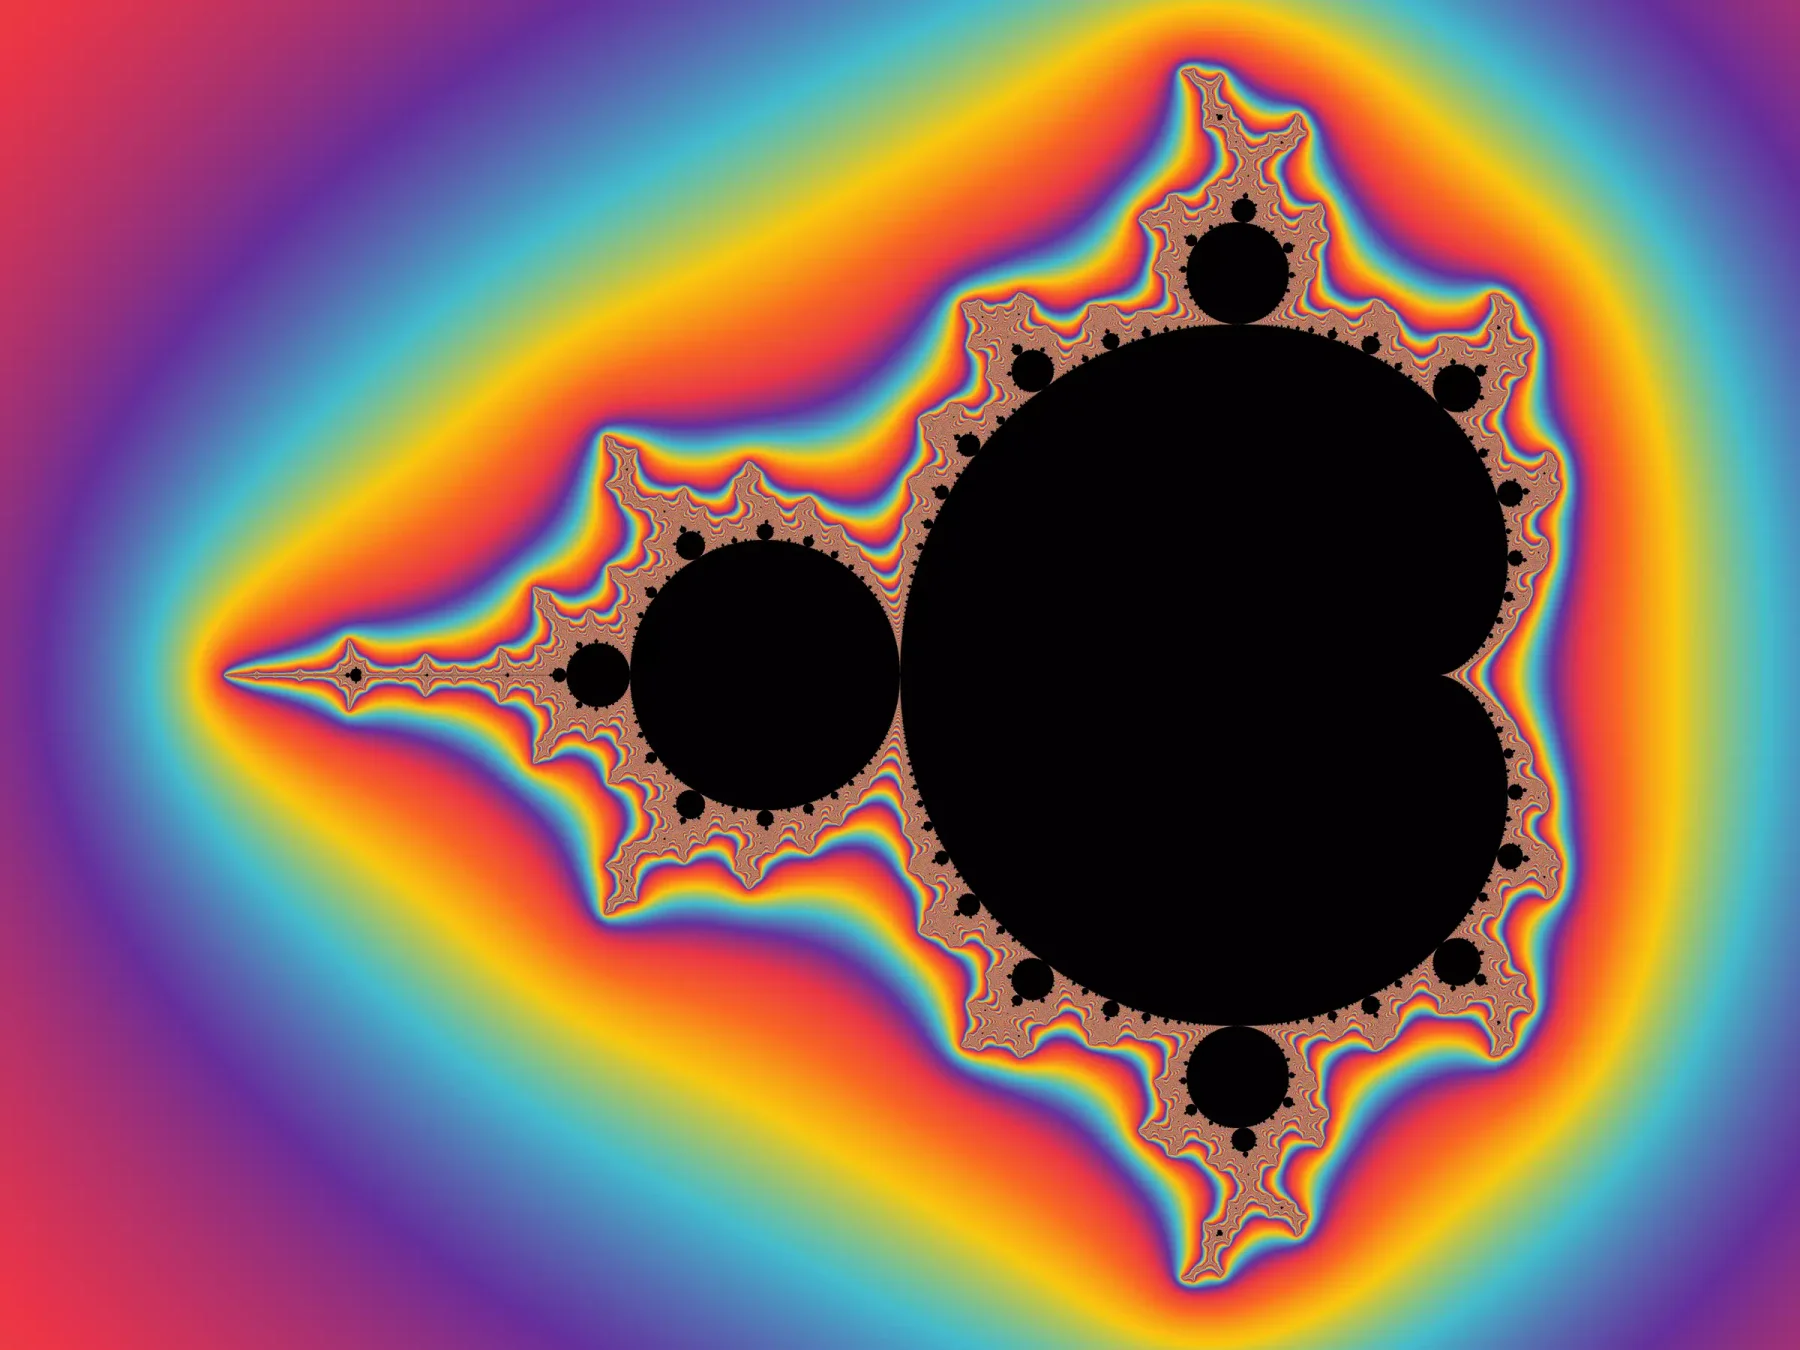
Move the slider to compare 40 and 320 escape iterations of the same Mandelbrot region. Both position and scale stay fixed.

40 iterations

320 iterations
Both complete images are shown.
Separate figures make you remember a detail while looking between them. This control keeps the same feature under your eye.
Use this comparison in a post
<ImageCompare before={firstRender} after={secondRender} beforeAlt="Describe the first render" afterAlt="Describe the second render" beforeLabel="40 iterations" afterLabel="320 iterations" />Give mixed images a shared row height
These are the same three uncropped images in the same order. The proposed layout assigns each image a width proportional to its shape.
Current · equal-width grid
-
Portrait · complete image -
Landscape · complete image -

Square · complete image
Proposed · proportional rows
-
Portrait · complete image -
Landscape · complete image -
Square · complete image
The portrait no longer sets the height of a mostly empty row. On phones, images stack at their natural proportions.
Use these rows in a post
<Gallery images={images} layout="rows" />Readable layouts
Center small results, give charts room to breathe, and keep wide content readable with local scrolling. These examples work before JavaScript loads.
Compact tables: content and background stay together
Before
The background stretches beyond the cells.
| Runout | Chance | Finish |
|---|---|---|
| RGG | 33.3% | $400 |
| GRG | 33.3% | $200 |
| GGR | 33.3% | $100 |
Now
The complete table is centered at its natural width.
| Runout | Chance | Finish |
|---|---|---|
| RGG | 33.3% | $400 |
| GRG | 33.3% | $200 |
| GGR | 33.3% | $100 |
Wide tables: use the available space
Long descriptions can wrap; numeric columns remain aligned. Scroll sideways on small screens.
| Strategy | When to use it | Guaranteed finish | Average finish |
|---|---|---|---|
| Maximum average | Accept a lower worst outcome for a larger average. | $100.00 | $233.33 |
| Maximum guarantee | Choose the strategy with the strongest worst outcome. | $200.00 | $200.00 |
Long results: a bounded table with a persistent header
Synthetic rows demonstrate vertical and horizontal scrolling inside one container.
| Sample | Configuration | Observations | Indexed value |
|---|---|---|---|
| 1 | Demonstration configuration 1 | 100 | 1.00 |
| 2 | Demonstration configuration 2 | 200 | 1.10 |
| 3 | Demonstration configuration 3 | 300 | 1.20 |
| 4 | Demonstration configuration 4 | 400 | 1.30 |
| 5 | Demonstration configuration 5 | 500 | 1.40 |
| 6 | Demonstration configuration 6 | 600 | 1.50 |
| 7 | Demonstration configuration 7 | 700 | 1.60 |
| 8 | Demonstration configuration 8 | 800 | 1.70 |
| 9 | Demonstration configuration 9 | 900 | 1.80 |
| 10 | Demonstration configuration 10 | 1000 | 1.90 |
| 11 | Demonstration configuration 11 | 1100 | 2.00 |
| 12 | Demonstration configuration 12 | 1200 | 2.10 |
| 13 | Demonstration configuration 13 | 1300 | 2.20 |
| 14 | Demonstration configuration 14 | 1400 | 2.30 |
| 15 | Demonstration configuration 15 | 1500 | 2.40 |
| 16 | Demonstration configuration 16 | 1600 | 2.50 |
| 17 | Demonstration configuration 17 | 1700 | 2.60 |
| 18 | Demonstration configuration 18 | 1800 | 2.70 |
| 19 | Demonstration configuration 19 | 1900 | 2.80 |
| 20 | Demonstration configuration 20 | 2000 | 2.90 |
| 21 | Demonstration configuration 21 | 2100 | 3.00 |
| 22 | Demonstration configuration 22 | 2200 | 3.10 |
| 23 | Demonstration configuration 23 | 2300 | 3.20 |
| 24 | Demonstration configuration 24 | 2400 | 3.30 |
Diagrams: preserve the lettering
This diagram stays centered on a wide screen. On a phone, scroll inside it to follow the flow.
Charts: reflow the axes and labels
The narrow layout uses fewer ticks and a taller plotting area. It shows the same six data points.
| Year | Synthetic indexed notes |
|---|---|
| 2019 | 3 |
| 2020 | 5 |
| 2021 | 8 |
| 2022 | 13 |
| 2023 | 11 |
| 2024 | 17 |
Paired charts: shared alignment
These Pikurn figures stack when there is insufficient room for two readable panels.
↔ Scroll each chart sideways to see its full range.
Visualization foundation
These examples keep the first render useful: exact geometry and the data plot are static HTML/SVG, while the harmonic model adds behavior only after it becomes visible.
| Year | Synthetic indexed notes |
|---|---|
| 2019 | 3 |
| 2020 | 5 |
| 2021 | 8 |
| 2022 | 13 |
| 2023 | 11 |
| 2024 | 17 |
Signal composition
Fourier harmonic explorer
Explore the shape of a signal: combine two sine waves, then adjust its strength and timing.
The default curve and equation remain available; controls will activate when ready.
Fundamental 1, harmonic 3, amplitude 0.45, phase 0 degrees.
Complex plane
Mandelbrot explorer
Pick a familiar region of the set, then increase the escape limit to expose more boundary detail.

Preparing the selected view.
Images, geometry, and source
These patterns retain the original image and make the intended display constraint explicit. The surrounding slot may crop; the source image does not.

Existing source uses the shared Expressive Code renderer and a raw import; it is not copied into a separate fence.
export const HARMONIC_LIMITS = { fundamental: { min: 1, max: 8, step: 1 }, harmonic: { min: 1, max: 12, step: 1 }, amplitude: { min: 0, max: 1, step: 0.05 }, phase: { min: -180, max: 180, step: 5 },} as const
export type HarmonicState = { fundamental: number harmonic: number amplitude: number phase: number}
export const DEFAULT_HARMONIC_STATE: HarmonicState = { fundamental: 1, harmonic: 3, amplitude: 0.45, phase: 0,}
export const HARMONIC_PRESETS = { 'Pure sine': { fundamental: 1, harmonic: 3, amplitude: 0, phase: 0 }, 'Warm third': DEFAULT_HARMONIC_STATE, 'Strong third': { fundamental: 1, harmonic: 3, amplitude: 0.9, phase: 0 },} as const satisfies Record<string, HarmonicState>
export type HarmonicPoint = { x: number; y: number }
function finite(value: unknown, fallback: number): number { return typeof value === 'number' && Number.isFinite(value) ? value : fallback}
function clamp( value: number, { min, max, step }: (typeof HARMONIC_LIMITS)[keyof typeof HARMONIC_LIMITS]) { const rounded = Math.round((Math.min(max, Math.max(min, value)) - min) / step) * step + min return Number(rounded.toFixed(8))}
export function normalizeHarmonicState(value: Partial<HarmonicState> = {}): HarmonicState { return { fundamental: clamp( finite(value.fundamental, DEFAULT_HARMONIC_STATE.fundamental), HARMONIC_LIMITS.fundamental ), harmonic: clamp( finite(value.harmonic, DEFAULT_HARMONIC_STATE.harmonic), HARMONIC_LIMITS.harmonic ), amplitude: clamp( finite(value.amplitude, DEFAULT_HARMONIC_STATE.amplitude), HARMONIC_LIMITS.amplitude ), phase: clamp(finite(value.phase, DEFAULT_HARMONIC_STATE.phase), HARMONIC_LIMITS.phase), }}
export function harmonicValue(x: number, state: HarmonicState): number { const phase = (state.phase * Math.PI) / 180 return ( Math.sin(2 * Math.PI * state.fundamental * x) + state.amplitude * Math.sin(2 * Math.PI * state.harmonic * x + phase) )}
export function harmonicSamples(state: HarmonicState, count = 241): HarmonicPoint[] { if (!Number.isInteger(count) || count < 2) throw new RangeError('Sample count must be an integer of at least 2') const normalized = normalizeHarmonicState(state) return Array.from({ length: count }, (_, index) => { const x = index / (count - 1) return { x, y: harmonicValue(x, normalized) } })}
function queryKeys(namespace: string): Record<keyof HarmonicState, string> { return { fundamental: `${namespace}-f`, harmonic: `${namespace}-h`, amplitude: `${namespace}-a`, phase: `${namespace}-p`, }}
export function harmonicHasState(search: string, namespace = 'hv'): boolean { const params = new URLSearchParams(search.startsWith('?') ? search.slice(1) : search) return Object.values(queryKeys(namespace)).some((key) => params.has(key))}
export function harmonicStateFromSearch(search: string, namespace = 'hv'): HarmonicState { const params = new URLSearchParams(search.startsWith('?') ? search.slice(1) : search) const raw: Partial<HarmonicState> = {} for (const [name, key] of Object.entries(queryKeys(namespace)) as [ keyof HarmonicState, string, ][]) { const value = params.get(key) if (value !== null && value.trim() !== '') raw[name] = Number(value) } return normalizeHarmonicState(raw)}
export function harmonicSearch(state: HarmonicState, base = '', namespace = 'hv'): string { const params = new URLSearchParams(base.startsWith('?') ? base.slice(1) : base) const normalized = normalizeHarmonicState(state) for (const [name, key] of Object.entries(queryKeys(namespace)) as [keyof HarmonicState, string][]) params.set(key, String(normalized[name])) return params.toString()}
export function harmonicCsv(state: HarmonicState): string { const normalized = normalizeHarmonicState(state) const rows = harmonicSamples(normalized).map(({ x, y }) => `${x.toFixed(6)},${y.toFixed(8)}`) return [ `# fundamental=${normalized.fundamental}, harmonic=${normalized.harmonic}, amplitude=${normalized.amplitude}, phase_degrees=${normalized.phase}`, 'x,signal', ...rows, ].join('\n')}Static diagrams
Mermaid is rendered during the build in both themes. This diagram needs no client JavaScript. Give each diagram a title and a description in its source.
Markdown reference
This page is a reference for markdown syntax and display, to sanity check that everything is working as expected, and appears properly when converted to HTML. It also tests features that might not be available in default configurations1, definition lists2, mathematical notation3, and tables4.
To see what it should look like, you can see it in action at: cade.io/test
Internal link test: link to code block
Text
Basic text in markdown is just plain text, which is rendered as-is. You can bold, italicize, underline, strikethrough, or preformat text by using special syntaces:
- bold text is surrounded by
**characters, as in:**bold text** - italic text is surrounded by
*characters, as in:*italic text* - underlined text is surrounded by
<u>tags, as in:<u>underlined text</u>(note: this is not standard markdown) strikethrough textis surrounded by<s>tags, as in:<s>strikethrough text</s>(note: this is not standard markdown)preformatted textis surrounded by backticks, as in:`preformatted text`
Furthermore, multiple styles of text can be combined, like bold italic text, by combining the syntaces: ***bold italic text***. Or, you can create really wild combinations like bold italic underlined strikethrough preformatted text
You can also add footnotes1 like this.
Block Quotes
Block quotes are denoted by prefixing lines with the > character,
> This is a block quote.>> It can span multiple lines, and contain other markdown syntax.A somewhat uncommon feature of block quotes is that they can be nested, for example when a quote contains another quote:
You miss 100% of the shots you don’t take.
– Wayne Gretzky
– Michael Scott
Further, in some cases there can be multiple levels of nesting, which is a good test for ensuring display styles are properly cascading:
I met a traveller from an antique land
Who said:
Two vast and trunkless legs of stone
Stand in the desart. Near them, on the sand,
Half sunk, a shattered visage lies whose frown,
And wrinkled lip, and sneer of cold command,
Tell that its sculptor well those passions read
Which yet survive, stamped on these lifeless things,
The hand that mocked them and the heart that fed:
And on the pedestal these words appear:
My name is Ozymandias, King of Kings:
Look on my works, ye Mighty, and despair!
No thing beside remains. Round the decay
Of that colossal wreck, boundless and bare
The lone and level sands stretch far away.
– Percy Bysshe Shelley, “Ozymandias”
And, we can also just use straightforward block quotes, without any nesting:
We can easily forgive a child who is afraid of the dark;
the real tragedy of life is when men are afraid of the light.
– Plato
No man has the right to be an amateur in the matter of physical training.
It is a shame for a man to grow old without seeing the beauty and strength of which his body is capable
– Socrates
Sample Text
Sed ut perspiciatis, unde omnis iste natus error sit voluptatem accusantium doloremque laudantium, totam rem aperiam eaque ipsa, quae ab illo inventore veritatis et quasi architecto beatae vitae dicta sunt, explicabo. nemo enim ipsam voluptatem, quia voluptas sit, aspernatur aut odit aut fugit, sed quia consequuntur magni dolores eos, qui ratione voluptatem sequi nesciunt, neque porro quisquam est, qui dolorem ipsum, quia dolor sit, amet, consectetur, adipisci velit, sed quia non numquam eius modi tempora incidunt, ut labore et dolore magnam aliquam quaerat voluptatem. ut enim ad minima veniam, quis nostrum exercitationem ullam corporis suscipit laboriosam, nisi ut aliquid ex ea commodi consequatur? quis autem vel eum iure reprehenderit, qui in ea voluptate velit esse, quam nihil molestiae consequatur, vel illum, qui dolorem eum fugiat, quo voluptas nulla pariatur?
At vero eos et accusamus et iusto odio dignissimos ducimus, qui blanditiis praesentium voluptatum deleniti atque corrupti, quos dolores et quas molestias excepturi sint, obcaecati cupiditate non provident, similique sunt in culpa, qui officia deserunt mollitia animi, id est laborum et dolorum fuga. et harum quidem rerum facilis est et expedita distinctio. nam libero tempore, cum soluta nobis est eligendi optio, cumque nihil impedit, quo minus id, quod maxime placeat, facere possimus, omnis voluptas assumenda est, omnis dolor repellendus. temporibus autem quibusdam et aut officiis debitis aut rerum necessitatibus saepe eveniet, ut et voluptates repudiandae sint et molestiae non recusandae. itaque earum rerum hic tenetur a sapiente delectus, ut aut reiciendis voluptatibus maiores alias consequatur aut perferendis doloribus asperiores repellat.
Code Snippets
Inline code has a small border. Code blocks use the shared renderer, with
syntax highlighting, line numbers, wrapping, and a copy button.
const outcomes = [400, 200, 100]const average = outcomes.reduce((sum, wealth) => sum + wealth, 0) / outcomes.lengthconsole.log(average)npm run validateImported source uses the same renderer and theme:
/** File-format builds expose .html while rendering; public HTML routes are slashless. */export function canonicalPath(pathname: string): string { return ( pathname .replace(/\/index\.html$/, '/') .replace(/\.html$/, '') .replace(/\/$/, '') || '/' )}
export function authorUrl(id: string): string { return `/authors/${encodeURIComponent(id)}`}Unicode Symbols
Box Drawing Characters
Unicode provides a set of special characters called box-drawing characters, which allows writing tables, diagrams, and other structures directly with text. Here is a table of the most common ones:
| Range | 0 | 1 | 2 | 3 | 4 | 5 | 6 | 7 | 8 | 9 | A | B | C | D | E | F |
|---|---|---|---|---|---|---|---|---|---|---|---|---|---|---|---|---|
| U+250x | ─ | ━ | │ | ┃ | ┄ | ┅ | ┆ | ┇ | ┈ | ┉ | ┊ | ┋ | ┌ | ┍ | ┎ | ┏ |
| U+251x | ┐ | ┑ | ┒ | ┓ | └ | ┕ | ┖ | ┗ | ┘ | ┙ | ┚ | ┛ | ├ | ┝ | ┞ | ┟ |
| U+252x | ┠ | ┡ | ┢ | ┣ | ┤ | ┥ | ┦ | ┧ | ┨ | ┩ | ┪ | ┫ | ┬ | ┭ | ┮ | ┯ |
| U+253x | ┰ | ┱ | ┲ | ┳ | ┴ | ┵ | ┶ | ┷ | ┸ | ┹ | ┺ | ┻ | ┼ | ┽ | ┾ | ┿ |
| U+254x | ╀ | ╁ | ╂ | ╃ | ╄ | ╅ | ╆ | ╇ | ╈ | ╉ | ╊ | ╋ | ╌ | ╍ | ╎ | ╏ |
| U+255x | ═ | ║ | ╒ | ╓ | ╔ | ╕ | ╖ | ╗ | ╘ | ╙ | ╚ | ╛ | ╜ | ╝ | ╞ | ╟ |
| U+256x | ╠ | ╡ | ╢ | ╣ | ╤ | ╥ | ╦ | ╧ | ╨ | ╩ | ╪ | ╫ | ╬ | ╭ | ╮ | ╯ |
| U+257x | ╰ | ╱ | ╲ | ╳ | ╴ | ╵ | ╶ | ╷ | ╸ | ╹ | ╺ | ╻ | ╼ | ╽ | ╾ | ╿ |
| U+258x | ▀ | ▁ | ▂ | ▃ | ▄ | ▅ | ▆ | ▇ | █ | ▉ | ▊ | ▋ | ▌ | ▍ | ▎ | ▏ |
| U+259x | ▐ | ░ | ▒ | ▓ | ▔ | ▕ | ▖ | ▗ | ▘ | ▙ | ▚ | ▛ | ▜ | ▝ | ▞ | ▟ |
Mathematical Symbols
Unicode provides a set of mathematical operators and symbols, which allows writing mathematical notation and equations directly with text. Here is a table of the most common ones:
| Range | 0 | 1 | 2 | 3 | 4 | 5 | 6 | 7 | 8 | 9 | A | B | C | D | E | F |
|---|---|---|---|---|---|---|---|---|---|---|---|---|---|---|---|---|
| U+220x | ∀ | ∁ | ∂ | ∃ | ∄ | ∅ | ∆ | ∇ | ∈ | ∉ | ∊ | ∋ | ∌ | ∍ | ∎ | ∏ |
| U+221x | ∐ | ∑ | − | ∓ | ∔ | ∕ | ∖ | ∗ | ∘ | ∙ | √ | ∛ | ∜ | ∝ | ∞ | ∟ |
| U+222x | ∠ | ∡ | ∢ | ∣ | ∤ | ∥ | ∦ | ∧ | ∨ | ∩ | ∪ | ∫ | ∬ | ∭ | ∮ | ∯ |
| U+223x | ∰ | ∱ | ∲ | ∳ | ∴ | ∵ | ∶ | ∷ | ∸ | ∹ | ∺ | ∻ | ∼ | ∽ | ∾ | ∿ |
| U+224x | ≀ | ≁ | ≂ | ≃ | ≄ | ≅ | ≆ | ≇ | ≈ | ≉ | ≊ | ≋ | ≌ | ≍ | ≎ | ≏ |
| U+225x | ≐ | ≑ | ≒ | ≓ | ≔ | ≕ | ≖ | ≗ | ≘ | ≙ | ≚ | ≛ | ≜ | ≝ | ≞ | ≟ |
| U+226x | ≠ | ≡ | ≢ | ≣ | ≤ | ≥ | ≦ | ≧ | ≨ | ≩ | ≪ | ≫ | ≬ | ≭ | ≮ | ≯ |
| U+227x | ≰ | ≱ | ≲ | ≳ | ≴ | ≵ | ≶ | ≷ | ≸ | ≹ | ≺ | ≻ | ≼ | ≽ | ≾ | ≿ |
| U+228x | ⊀ | ⊁ | ⊂ | ⊃ | ⊄ | ⊅ | ⊆ | ⊇ | ⊈ | ⊉ | ⊊ | ⊋ | ⊌ | ⊍ | ⊎ | ⊏ |
| U+229x | ⊐ | ⊑ | ⊒ | ⊓ | ⊔ | ⊕ | ⊖ | ⊗ | ⊘ | ⊙ | ⊚ | ⊛ | ⊜ | ⊝ | ⊞ | ⊟ |
| U+22Ax | ⊠ | ⊡ | ⊢ | ⊣ | ⊤ | ⊥ | ⊦ | ⊧ | ⊨ | ⊩ | ⊪ | ⊫ | ⊬ | ⊭ | ⊮ | ⊯ |
| U+22Bx | ⊰ | ⊱ | ⊲ | ⊳ | ⊴ | ⊵ | ⊶ | ⊷ | ⊸ | ⊹ | ⊺ | ⊻ | ⊼ | ⊽ | ⊾ | ⊿ |
| U+22Cx | ⋀ | ⋁ | ⋂ | ⋃ | ⋄ | ⋅ | ⋆ | ⋇ | ⋈ | ⋉ | ⋊ | ⋋ | ⋌ | ⋍ | ⋎ | ⋏ |
| U+22Dx | ⋐ | ⋑ | ⋒ | ⋓ | ⋔ | ⋕ | ⋖ | ⋗ | ⋘ | ⋙ | ⋚ | ⋛ | ⋜ | ⋝ | ⋞ | ⋟ |
| U+22Ex | ⋠ | ⋡ | ⋢ | ⋣ | ⋤ | ⋥ | ⋦ | ⋧ | ⋨ | ⋩ | ⋪ | ⋫ | ⋬ | ⋭ | ⋮ | ⋯ |
| U+22Fx | ⋰ | ⋱ | ⋲ | ⋳ | ⋴ | ⋵ | ⋶ | ⋷ | ⋸ | ⋹ | ⋺ | ⋻ | ⋼ | ⋽ | ⋾ | ⋿ |
Lists
Unordered Lists
Here’s an example of an unordered list:
- Item 1
- Item 2
- Item 3
And here’s another example that also nests other lists:
- Item 1
- Item 2
- Item 2.1
- Item 2.2
- Item 3
- Item 3.1
- Item 3.1.1
- Item 3.1.2
- Item 3.2
- Item 3.2.1
- Item 3.2.1.1
- Item 3.2.1
- Item 3.1
- Item 4
Ordered Lists
Here’s an example of an ordered list:
- Item 1
- Item 2
- Item 3
And here’s another example that also nests other lists:
- Item 1
- Item 2
- Item 3
- Item 3.1
- Item 3.2
- Item 3.3
- Item 4
- Item 4.1
- Item 4.1.1
- Item 4.1.2
- Item 4.2
- Item 4.2.1
- Item 4.2.2
- Item 4.1
- Item 5
Definition Lists
Here’s an example of a definition list, which is not standard markdown, but is supported by some markdown processors:
- Term 1
- Definition 1
- Term 2
- Definition 2
- And it can have multiple definitions
- Term 3
- Definition 3
- And it can have fancy text too
Tables
Here’s an example of a table of the largest cities in the world (from Wikipedia):
| Rank | City | Population | Country | Year |
|---|---|---|---|---|
| 1 | Shanghai | 21,909,814 | China | 2020 |
| 2 | Delhi | 21,359,000 | India | 2023 |
| 3 | Karachi | 20,382,881 | Pakistan | 2023 |
| 4 | Beijing | 18,960,744 | China | 2020 |
| 5 | Shenzhen | 17,444,609 | China | 2020 |
| 6 | Kinshasa | 16,316,000 | Democratic Republic of Congo | 2023 |
| 7 | Guangzhou | 16,096,724 | China | 2020 |
| 8 | Lagos | 15,946,000 | Nigeria | 2023 |
| 9 | İstanbul | 15,907,951 | Turkey | 2022 |
Here’s another which represents the Figurate Number Sequences (i.e. triangular numbers, tetrahedral numbers, and so on):
| 1 | 1 | 1 | 1 |
| 2 | 3 | 4 | 5 |
| 3 | 6 | 10 | 15 |
| 4 | 10 | 20 | 35 |
| 5 | 15 | 35 | 70 |
| 6 | 21 | 56 | 126 |
| 7 | 28 | 84 | 210 |
| 8 | 36 | 120 | 330 |
| 9 | 45 | 165 | 495 |
And those column labels are:
$ T_n $, the triangular numbers are given by:$ S_n $, the square pyramidal numbers are given by:$ P_n $, the pentagonal numbers are given by:
Assets
Images
Here’s an example of an image:

References
-
Markdown Cheat Sheet, a quick reference and guide to Markdown syntax ↑1 ↑2
-
Definition Lists, a very cool HTML feature that is sorely missing from common markdown. The native Markdown processor supports these. ↑1
-
LaTeX Equations, a typesetting system commonly used for mathematical notation. KaTeX renders these equations as HTML and MathML. ↑1
-
Markdown Tables - even though it doesn’t support things like a column of headers, or sums at the end, having nice styles on tabular data makes data science easy! ↑1
Social preview
One generated card, shown as a wide preview and a narrow chat-style crop.